An Old Seasonal Truism
Most people are probably aware of the saying “sell in May and go away”. This popular seasonal Wall Street truism implies that the market's performance is far worse in the six summer months than in the six winter months.
Numerous studies have been undertaken particularly with respect to US stock markets, which confirm the relative weakness of the stock market in the summer.
What is the status of the “sell in May” rule in other countries though? I have examined the patterns in the eleven most important stock markets in the world.
The Eleven Largest Markets in the World Under the Seasonal Microscope
I have taken a look at the popular benchmark stock indexes of the eleven countries with the largest market capitalization from 1970 onward, or starting from the earliest year as of which continuous price data are available.
The comparison divides the calendar year into a summer half-year from May to October and a winter half-year from November to April. The position is assumed to be closed out on the first trading day of the following month. In the respective half-year in which no position in stocks is taken, a cash position that earns no interest is assumed to be held, so as to avoid any distortions of the stock market's seasonal returns by including interest income.
This much I will say in advance: The results are clear, in all eleven countries the winter half-year outperformed the summer half-year significantly. In the majority of these eleven countries one would actually have lost money during the summer half-year on average! These countries are:
- Canada
- France
- Germany
- Japan
- Taiwan
- United Kingdom
In other words, in these countries it would have been definitely better to go on vacation in the summer months – or to invest elsewhere.
The Half-Year Patterns of the Eleven Selected Countries
The charts below show the chained stock market performance in all eleven countries during the summer months in red, during the winter months in green as well as the full year returns (=actual performance of the index) in blue.
Note: the charts are linearly scaled, as a result of which the performance patterns of the summer and winter half-year periods visually don't appear to add up to the full year performance.
Canada: Summer Half-Year vs. Winter Half-Year
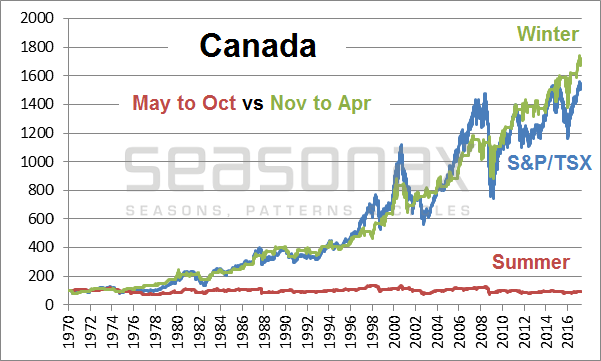
The winter half-year even beats the full year. Source: Seasonax
China: Summer Half-Year vs. Winter Half-Year
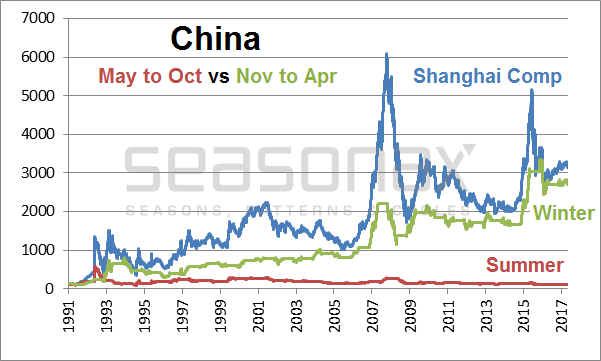
Prices rise almost as strongly in the winter months as over the full year. Source: Seasonax
France: Summer Half-Year vs. Winter Half-Year
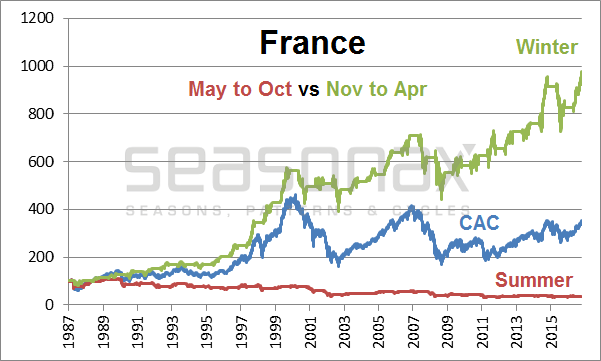
The winter half-year beats the full year significantly. Source: Seasonax
Germany: Summer Half-Year vs. Winter Half-Year
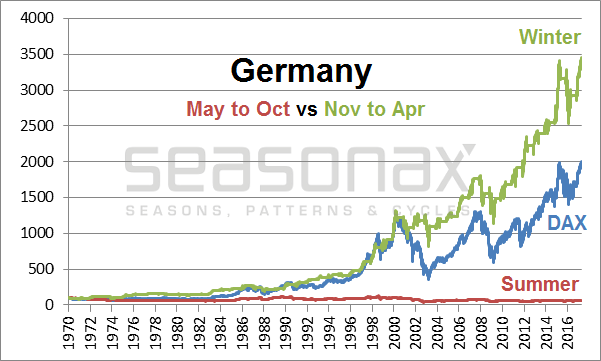
Once again the winter half-year clearly beats even the year as a whole. Source: Seasonax
Hong Kong: Summer Half-Year vs. Winter Half-Year
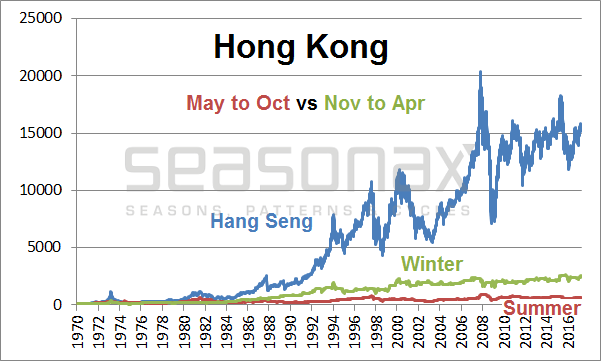
The second-best performing summer half-year in our selection. Source: Seasonax
India: Summer Half-Year vs. Winter Half-Year
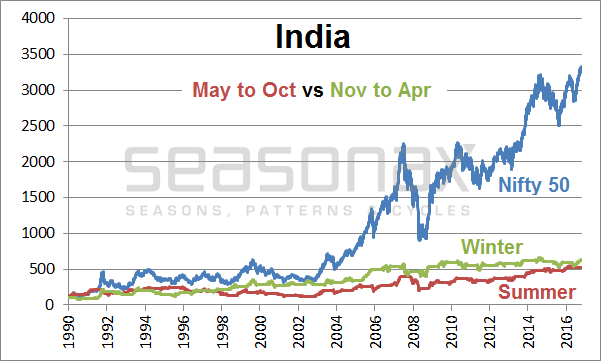
Only in India is the market's performance during the summer nearly as strong as in the winter. Source: Seasonax
Japan: Summer Half-Year vs. Winter Half-Year
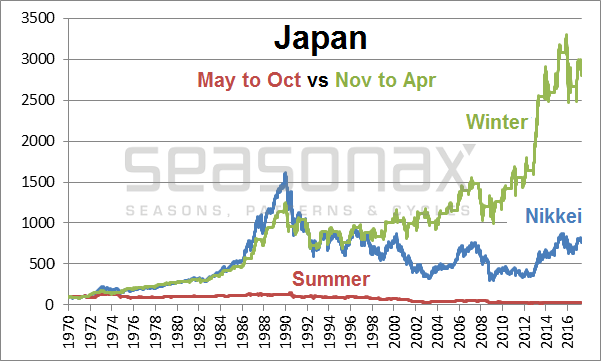
If one employs the “sell in May” strategy, even Japan is in a long term bull market. Source: Seasonax
Korea: Summer Half-Year vs. Winter Half-Year
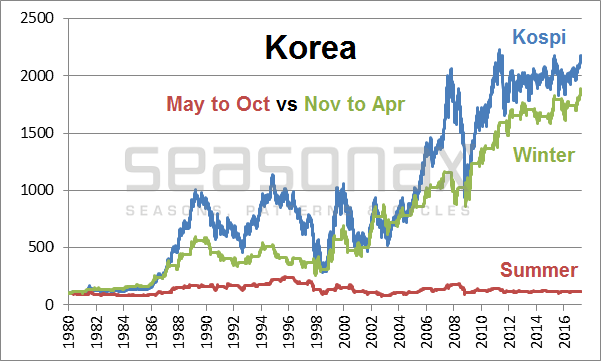
During the winter prices rise almost as much as over the year as a whole. Source: Seasonax
Taiwan: Summer Half-Year vs. Winter Half-Year
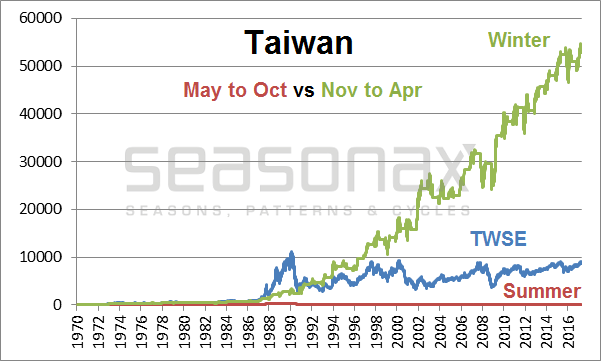
In Taiwan the summer half-year is deeply in the red. Source: Seasonax
United Kingdom: Summer Half-Year vs. Winter Half-Year
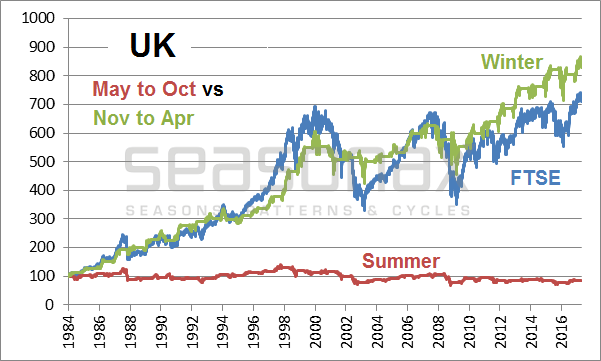
It suffices to be invested during the winter months. Source: Seasonax
US: Summer Half-Year vs. Winter Half-Year
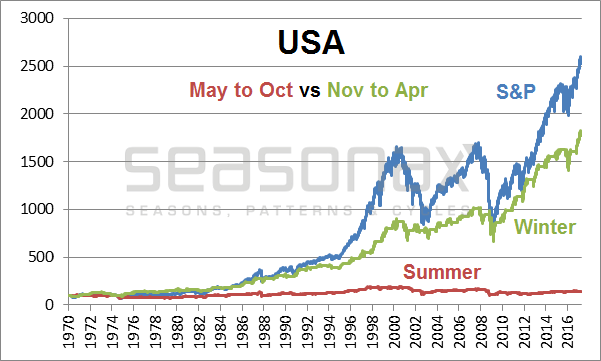
The winter half-year beats the summer half-year, but not the full year. Source: Seasonax
As you can see, only two of the eleven largest stock markets in the world are actually posting notable gains in the summer half-year: Hong Kong and India.
In all other markets it was sensible and profitable to sell in early May – as in these other countries the markets either posted losses or gains of less than one percent in the summer months. Investing in these markets during the summer was barely worth it, after all, by employing the “sell in May” strategy one is also exposed to less risk because one is only invested half of the time.
Detailed Results by Country
The following table shows the half-year results of the eleven countries in detail. Half-year periods in which it was profitable to be invested on a risk-adjusted basis are highlighted in green. Half-year periods that generated losses are highlighted in red.
Overview of Country Selection: Half-Year Results
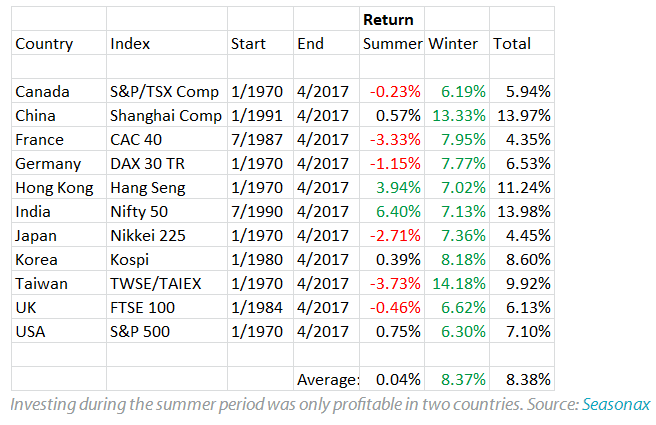
The table underscores that the summer weakness (a.k.a. the “Halloween Effect”) does indeed exist. In this case, we are looking at a very simple and well-known rule. There exist many more seasonal patterns, which one can e.g. identify with the Seasonax app on Bloomberg and / or Thomson Reuters. Many of them are still completely unknown.
“Sell in May” by contrast is a rule people have been aware of for decades. Nevertheless, the pattern still works. Apparently a far too small number of investors is actually taking action based on their knowledge of the pattern and there is almost no arbitrage either. The stability and persistence of the pattern suggests that “sell in May” will continue to work in the future.
